Remote Sensing Image Analysis
Mapping Water and Vegetation Across an Entire Arid Landscape in the Grand Canyon
The Grand Canyon is not merely a geological wonder; it is actually a living laboratory in the investigation of how both water and vegetation survived in one of the most arid places on earth. Dryness and the changing patterns of climate have made it even more critical to monitor these vulnerable ecosystems. But how do you monitor such sparse desert vegetation or ephemeral sources of water over such vast, rugged terrain? The answer lies in the skies: satellite imagery.
In this project, Sentinel-2’s satellite data is used to detect water and vegetation in the Grand Canyon. The high-resolution bands of Sentinel-2—for example, near-infrared (NIR) and shortwave infrared (SWIR)—are the best ones to capture subtle ecological traits that cannot be seen with the naked eye. By calculating indices such as the Normalized Difference Water Index (NDWI) and Normalized Difference Vegetation Index (NDVI), oases and greenery hidden within the maze of red rock that comprises the canyon is mapped out.
import numpy as np
import rasterio
import matplotlib.pyplot as plt
import matplotlib.patches as patches
from skimage import measure
true_color_path = "image_data_path/2019-11-04-00_00_2019-11-04-23_59_Sentinel-2_L2A_True_color.tiff"
green_path = "image_data_path/2019-11-04-00_00_2019-11-04-23_59_Sentinel-2_L2A_B03_(Raw).tiff"
nir_path = "image_data_path/2019-11-04-00_00_2019-11-04-23_59_Sentinel-2_L2A_B08_(Raw).tiff"
red_path = "image_data_path/2019-11-04-00_00_2019-11-04-23_59_Sentinel-2_L2A_B04_(Raw).tiff"
with rasterio.open(true_color_path) as src:
true_color = src.read([1, 2, 3]).transpose(1, 2, 0)
with rasterio.open(green_path) as src: # B03 (Green)
green = src.read(1).astype(float)
with rasterio.open(nir_path) as src: # B08 (NIR)
nir = src.read(1).astype(float)
with rasterio.open(red_path) as src: # B04 (Red)
red = src.read(1).astype(float)
# Get indices
ndwi = (green - nir) / (green + nir + 1e-6) # NDWI for water
ndvi = (nir - red) / (nir + red + 1e-6) # NDVI for vegetation
water_mask = ndwi > 0.05
greenery_mask = ndvi > 0.43
# Smoothing to reduce noise
from skimage.filters import gaussian
water_mask = gaussian(water_mask, sigma=1) > 0.5
greenery_mask = gaussian(greenery_mask, sigma=1) > 0.5
fig, ax = plt.subplots(figsize=(10, 10))
ax.imshow(true_color / true_color.max())
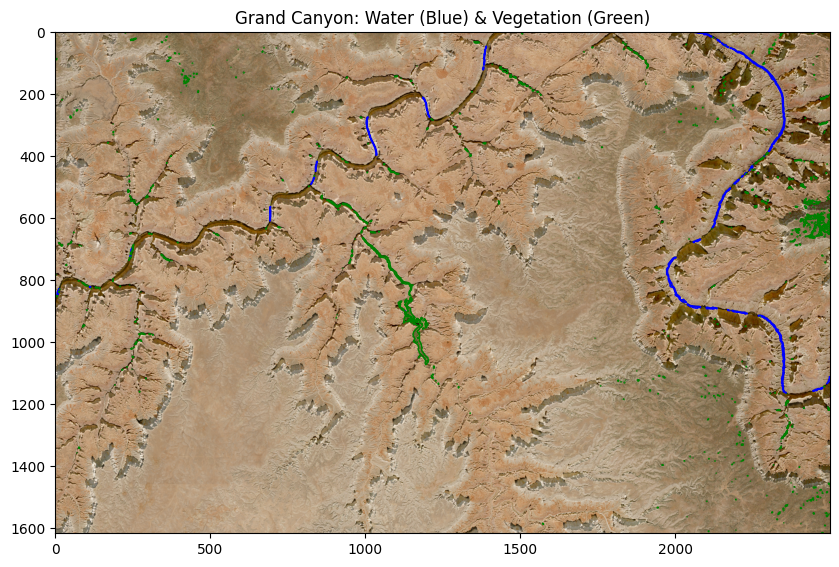
ax.set_title('Grand Canyon: Water (Blue) & Vegetation (Green)')
for contour in measure.find_contours(water_mask, level=0.5):
contour_coords = np.fliplr(contour)
poly = patches.Polygon(contour_coords, closed=True, fill=False, edgecolor='blue', linewidth=1)
ax.add_patch(poly)
for contour in measure.find_contours(greenery_mask, level=0.5):
contour_coords = np.fliplr(contour)
poly = patches.Polygon(contour_coords, closed=True, fill=False, edgecolor='green', linewidth=1)
ax.add_patch(poly)
plt.show()Desert-Property-Problem
The water is not made of enormous lakes, but made up of short puddles or meandering channels, and vegetation sparsely hangs by in patches and blends into the rocky background. NDWI and NDVI, originally set for lush conditions, fail here. For example, a water threshold of 0.11 would work in the temperate zones, but it’s reduced here in the Grand Canyon to 0.05. On the other end, the vegetation would also record lower NDVIs for example the drought-resistant shrubs hence set was set at 0.43 to avoid missing these pockets.
From Pixels to Insights
Using Python’s rasterio and skimage, process the raw bands of Sentinel-2 into true-color composites and indexes. One principal hurdle was the correlation of the number of bands in the satellite with the actual wavelengths (e.g., Band 03 to be green, Band 04 red, and Band 08 NIR). After the application of Gaussian filters to smooth the data and reduce noise, map contours of water and vegetation directly onto the true-color image.
The result? Clear overlays of blue waterways snaking through the canyon and green vegetation clinging to shaded slopes against the surrounding harsh desert environment.
Why this matters
Beyond the technical adjustment, it was evident how remote sensing could create links between satellite data and conservation on the ground. For the ecologists, it pictures how vegetation changes under extreme arid conditions. And for the rest of us, they remind us that life finds a way even in deserts, if one knows where to look.